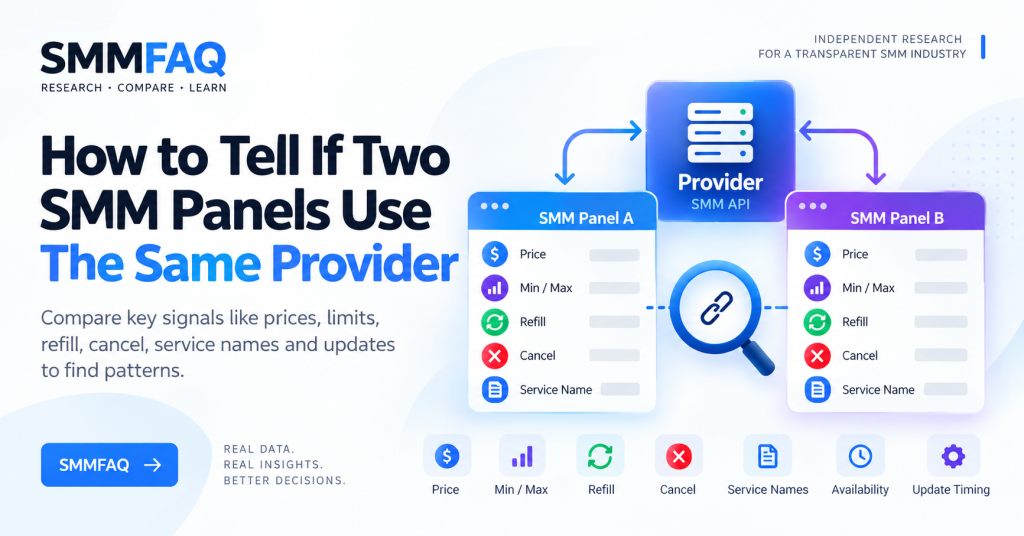
Two SMM panels can look completely different while selling services from the same upstream provider.
The opposite is also possible: two panels can use similar service names, prices and categories while relying on completely different providers.
That means there is rarely one field that proves a shared provider relationship.
A better approach is to compare multiple service-level signals such as:
- price,
- minimum and maximum quantity,
- refill,
- cancel,
- service descriptions,
- update timing,
- availability changes,
- API catalog patterns,
- and repeated behavior across several services.
The more unusual characteristics two panels share at the same time, the stronger the research signal becomes.
But similarity is still not the same as proof.
If you are unfamiliar with how panel supply chains work, first read How Do SMM Panels Get Their Services?.
Can Two SMM Panels Use the Same Provider?
Yes.
A single upstream provider can supply services to many reseller panels through an API.
A simplified structure may look like this:
Upstream Provider
      ↓
   SMM API
      ↓
 ┌────┴────┐
Panel A  Panel B
Both panels may then:
- rename services,
- change prices,
- organize categories differently,
- add their own markup,
- and present the services through completely different websites.
This is why the customer-facing panel name does not necessarily identify the original source.
For a deeper explanation of provider roles, see What Is an SMM Panel Provider?.
1. Compare Minimum and Maximum Quantities
Min and max values are among the easiest fields to compare.
Consider these two services:
Panel A
Min: 250
Max: 875,000
Panel B
Min: 250
Max: 875,000The match may be meaningful because the maximum quantity is relatively specific.
But if both services show:
Min: 100
Max: 10,000
the signal is weaker because those are common values.
A useful rule is:
The more unusual the matching limits are, the more useful they become as a research signal.
2. Compare Price Changes Over Time
Static price similarity is not especially strong evidence.
Many panels compete around similar rates.
For example:
Panel A: $0.42 / 1K
Panel B: $0.44 / 1K
does not tell us much.
Price movement can be more interesting.
Suppose this happens:
Monday
Panel A: $0.42
Panel B: $0.48
Then:
Tuesday
Panel A: $0.61
Panel B: $0.69
Both increased at approximately the same time.
If similar synchronized movements happen repeatedly across many services, it may indicate that both panels are reacting to the same upstream price changes.
To understand why panel prices change, see Why Do SMM Panel Prices Differ?.
3. Compare Refill Conditions
Refill characteristics can be another useful signal.
For example:
| Panel | Refill |
|---|---|
| Panel A | 30 Days |
| Panel B | 30 Days |
| Panel C | No Refill |
A common 30-day refill alone is weak evidence.
But a more unusual pattern can be more useful:
Refill: 365 Days
Min: 250
Max: 2,000,000
Cancel: Yes
If two panels repeatedly share this same combination, the relationship becomes more interesting.
For refill terminology, see What Does Refill Mean in an SMM Panel?.
4. Compare Cancel Availability
Cancel status can change when the upstream provider changes how a service is managed.
Suppose:
Panel A
Cancel: Yes
Panel B
Cancel: YesThat alone means very little.
But imagine both panels change to:
Cancel: Noon the same day, while their other service characteristics remain similar.
That timing creates a stronger correlation.
See What Does Cancel Mean in an SMM Panel? for more context.
5. Watch When Services Appear and Disappear
Service availability can provide useful clues.
An upstream service might be disabled because of:
- maintenance,
- supplier problems,
- platform changes,
- delivery instability,
- pricing changes,
- or provider-side capacity issues.
If the same unusual service disappears from several panels at approximately the same time, that can indicate a shared dependency.
For example:
10:00
Panel A service disabled

10:07
Panel B service disabled

10:15
Panel C service still active
This pattern does not prove that A and B use the same provider.
But it gives a researcher something worth investigating.
6. Compare Service Reappearance Timing
The reverse can also happen.
If an unusual service disappears from two panels and later returns at nearly the same time with:
- a new price,
- new max quantity,
- new refill period,
- or modified name,
that sequence can be more informative than any single value.
Changes over time are generally more useful than one screenshot.
7. Look for Unusual Service Descriptions
Some providers use distinctive wording.
For example:
Start: Instant - 15 Minutes
Speed: Up to 75K / Day
Drop: Possible
Refill: 45 Days
A reseller may import that wording directly.
Another reseller may lightly modify it.
If multiple panels share:
- unusual grammar,
- identical punctuation,
- the same uncommon abbreviation,
- the same spelling mistake,
- and the same sequence of specifications,
that can suggest a shared source.
However, descriptions are easy to copy manually, so this evidence should never be used alone.
8. Do Identical Service IDs Prove a Shared Provider?
Not necessarily.
Service IDs are usually local identifiers.
For example:
Panel A
Service ID: 142
Panel B
Service ID: 142This does not automatically mean they use the same provider.
Both panels could independently have a service numbered 142.
There are also systems that preserve upstream IDs during import, which means matching IDs can occasionally be useful context.
The important point is:
Matching service IDs are a weak signal unless other service characteristics also match.
9. Different Service IDs Can Still Be the Same Service
The opposite is also true.
Panel A may show:
ID 2814while Panel B shows:
ID 957Both could still route to the same upstream service.
This happens because reseller systems often assign their own internal service IDs.
Therefore:
Different ID ≠ Different Providerand:
Same ID ≠ Same Provider10. Compare Service Names Carefully
Service names are useful but unreliable.
Consider:
Instagram Followers | HQ | Refilland:
Instagram HQ Followers | 30D RefillThese may be:
- the same upstream service,
- different services from the same provider,
- or unrelated services.
Names are often rewritten by resellers.
Therefore, service names should be compared alongside limits and operational fields.
11. Watch for Identical Unusual Errors
Operational errors can sometimes expose shared infrastructure.
Imagine two panels show the same unusual error condition during the same period:
Service temporarily unavailableor both begin rejecting a very specific link format at the same time.
This may suggest a shared dependency.
But many panels use the same software and scripts, so identical generic errors are not enough.
Only unusual, synchronized patterns are particularly useful.
12. Compare Multiple Services, Not One
This is one of the most important rules.
Suppose one Instagram service matches across two panels.
That could be coincidence.
Instead, compare:
- 5 services,
- 10 services,
- or an entire category.
For example:
| Attribute | Panel A | Panel B |
|---|---|---|
| Instagram Service 1 | Similar | Similar |
| Instagram Service 2 | Similar | Similar |
| TikTok Service 1 | Similar | Similar |
| Telegram Service 1 | Different | Different |
| YouTube Service 1 | Different | Different |
This could suggest that the panels share one provider for Instagram but use different sources elsewhere.
Panels do not necessarily have one universal provider.
Can One SMM Panel Use Multiple Providers?
Yes.
This is extremely common.
A panel could source:
Instagram → Provider A
TikTok → Provider B
YouTube → Provider C
Telegram → Provider D
It could even use multiple providers within the same platform:
Instagram Followers → Provider A
Instagram Likes → Provider B
Instagram Views → Provider C
This is why asking:
Who is this panel’s provider?
can be too broad.
A more accurate question is:
Which provider may be supplying this specific service or category?
13. Compare Categories Across Panels
Category structure can provide hints, particularly when API imports are copied with minimal modification.
For example:
Instagram Followers [Stable]
Instagram Followers [Fast]
Instagram Followers [Refill]
Instagram Followers [Premium]
If another panel has the exact same unusual ordering and naming conventions, this can support other evidence.
But common category names are not enough.
14. Compare API Catalog Changes
For panels with APIs, catalog monitoring can reveal more than manually browsing the website.
A typical SMM API may return fields such as:
service
name
type
rate
min
max
refill
cancel
category
For more background, see What Is an SMM Panel API?.
If two panel APIs repeatedly show synchronized changes across the same cluster of services, that may suggest shared upstream data.
15. Watch for Matching Rate Ratios
Resellers often add markup to an upstream price.
Imagine:
Panel A: $0.50
Panel B: $0.60
Later:
Panel A: $0.75
Panel B: $0.90
Panel B remains approximately 20% more expensive.
That can be interesting if the relationship remains stable across many services.
It may indicate that one panel is applying a consistent markup to prices originating from the same supplier.
This is still only a pattern.
Example: Possible Fixed Markup
Suppose:
| Service | Panel A | Panel B |
|---|---|---|
| Service 1 | $0.50 | $0.60 |
| Service 2 | $1.00 | $1.20 |
| Service 3 | $2.00 | $2.40 |
| Service 4 | $5.00 | $6.00 |
Every Panel B rate is 20% higher.
Possible explanations include:
- Panel B resells Panel A,
- both use the same upstream provider with different markups,
- both use a pricing formula,
- or the similarity is coincidental.
You need additional evidence before choosing between these explanations.
16. Look at Update Timing
If SMMFAQ records the last update time of synchronized services, timing becomes useful.
For example:
Panel A service changed: 14:02
Panel B service changed: 14:08
Repeated short delays can indicate downstream synchronization.
One isolated event means little.
A recurring pattern across dozens of updates is more valuable.
The SMMFAQ Services Database can be used to compare current service-level fields.
17. Check Whether the Difference Looks Like a Reseller Markup
Imagine:
Panel A
$0.500 / 1K
Panel B
$0.575 / 1KThe difference is exactly 15%.
If many matching services show roughly the same markup, that can be consistent with reseller pricing.
However, panels may use:
- percentage markup,
- fixed markup,
- category-specific markup,
- service-specific pricing,
- or manually edited prices.
So pricing alone still cannot establish a reseller relationship.
18. Compare Multiple Platforms
This can reveal whether the relationship is broad or limited.
Suppose:
Panel A and Panel B match closely.
TikTok
They are completely different.
Telegram
They are completely different.
A reasonable hypothesis would be:
The panels may share some Instagram supply, but not necessarily the same overall provider structure.
This is more precise than saying the two panels “use the same provider.”
19. Look at Refill and Cancel Changes Together
Suppose a service originally has:
Refill: 30 Days
Cancel: Yes
Then both panels simultaneously change to:
Refill: No
Cancel: No
while price and max quantity also change.
That bundle of changes is more informative than one matching field.
Researchers should prioritize clusters of synchronized changes.
20. Compare Service Pauses
Temporary pauses are common in SMM catalogs.
If a specific service repeatedly enters and exits active status on two panels at the same times, it can point toward a shared dependency.
For example:
Day 1
A: Active
B: Active

Day 2
A: Disabled
B: Disabled

Day 3
A: Active
B: Active
Repeated cycles are more meaningful than a one-time outage.
21. Do Identical Speeds Prove Anything?
Not usually.
Terms such as:
10K/day
50K/day
Instant
Fast
Super Fast
are widely reused.
A very unusual combination is more interesting:
Start: 0-5 minutes
Speed: 37K/day
Max: 875K
Refill: 45 days
If the same combination appears across multiple panels, it provides a stronger clue.
22. Look for Formatting Fingerprints
Catalog text can contain recognizable formatting.
Examples:
♻️ Refill 30 Days
⚡ Speed 50K/D
✅ Cancel Enabled
or:
[REFILL: 30D] [MAX: 500K] [START: 0-1H]A provider may distribute service names and descriptions with these patterns.
Again, resellers can edit them.
Think of these as fingerprints, not proof.
23. Why Service Names Can Mislead You
Some reseller panels intentionally rename imported services.
They may change:
Instagram Followers | Provider Service #2into:
Premium Instagram FollowersThe underlying API order can still be routed to the original provider service.
This makes visible service names one of the easiest fields to disguise.
24. Can the Website Design Reveal the Provider?
Usually not.
Two panels using the same script may look similar despite having unrelated suppliers.
Two panels using the same provider may also look completely different.
Website design tells you more about:
- frontend theme,
- software,
- branding,
- and usability
than about the upstream service source.
25. Can Domain WHOIS Data Reveal a Shared Provider?
Sometimes it can reveal shared ownership or infrastructure, but it does not prove service sourcing.
For example, two panels could have:
- the same owner,
- the same hosting,
- the same DNS,
- or the same company
while using different upstream providers.
Likewise, independent companies could use the same SMM supplier.
Infrastructure and supply-chain research are different questions.
What Counts as Strong Evidence?
A stronger case usually combines several of these:
- unusual identical min/max,
- synchronized price changes,
- synchronized refill changes,
- synchronized cancel changes,
- identical unusual service descriptions,
- repeated availability changes,
- stable markup relationships,
- matching catalog additions,
- matching catalog removals,
- similar update timing.
You can think of the evidence as cumulative.
For example:
Same price only
= weak

Same price + same min/max
= more interesting

Same price + unusual min/max + same refill/cancel
= stronger

All of the above + repeated synchronized updates
= much stronger research signal
Still, public catalog data may not prove the relationship with certainty.
What Is Not Enough to Prove a Shared Provider?
These should not be treated as proof by themselves:
| Signal | Strength Alone |
|---|---|
| Same service name | Weak |
| Same category name | Weak |
| Similar price | Weak |
| Same service ID | Weak |
| Same website script | Weak |
| Same refill duration | Weak |
| Same min/max | Moderate if unusual |
| Repeated synchronized changes | Stronger signal |
| Multiple unusual matching fields | Stronger signal |
The quality of the evidence matters more than the number of generic similarities.
Example Investigation
Imagine Panel A and Panel B list an Instagram service.
Panel A
Price: $0.72
Min: 250
Max: 875,000
Refill: 45 Days
Cancel: Yes
Panel B
Price: $0.83
Min: 250
Max: 875,000
Refill: 45 Days
Cancel: Yes
So far, the match is interesting.
Three days later:
Panel A
Price: $0.94
Max: 500,000
Cancel: No
Panel B
Price: $1.08
Max: 500,000
Cancel: No
Both changed in similar ways.
Later, both services disappear.
Then they reappear with:
Max: 1,000,000
Refill: 30 Days
At this point, the shared-provider hypothesis becomes more plausible.
But the correct conclusion is still:
The services show multiple characteristics consistent with a shared upstream source.
Not:
They definitely use the same provider.
How SMMFAQ Can Be Used for Provider Research
SMMFAQ is structured to make these comparisons easier using observable fields.
The SMMFAQ Services Database lets you compare:
- provider,
- service ID,
- service name,
- category,
- price,
- minimum,
- maximum,
- refill,
- cancel,
- and update time.
The SMMFAQ Provider Directory provides broader provider-level context.
Used together, these pages make it easier to move from:
Service similarity
↓
Provider research
↓
Catalog comparison
↓
Historical pattern
rather than relying on one price or one service name.
Can You Identify the Original Main Provider?
Sometimes you can develop a strong hypothesis.
But identifying the original source becomes harder when there are multiple layers.
For example:
Source
↓
Provider A
↓
Aggregator B
↓
Reseller C
↓
Reseller D
Panel D may appear to source services from C.
But C may itself be sourcing from B.
And B may be sourcing from A.
This is why the term main provider can be misleading unless the supply chain is actually known.
Can a Provider Also Be a Reseller?
Yes.
A panel can provide some services directly and resell others.
For example:
Own Instagram Service
+
Resold TikTok Services
+
Third-party Telegram Services
This hybrid model makes provider detection even more complicated.
It is often more accurate to investigate the source of individual services rather than classify an entire panel with one label.
Why This Matters for Price Research
Shared provider relationships can explain why several panels change prices together.
Suppose the upstream provider raises a service from:
$0.40 → $0.55Resellers may later move:
Panel A: $0.48 → $0.65
Panel B: $0.52 → $0.70
Panel C: $0.60 → $0.79
The final prices differ because each reseller uses a different markup.
But the underlying movement may come from the same source.
That is one reason price research should be combined with provider research.
Why This Matters for Service Reliability Research
If several panels depend on the same upstream source, a problem at that provider may affect them simultaneously.
This can include:
- slower delivery,
- disabled services,
- refill delays,
- cancellation changes,
- or unavailable categories.
From the outside, it may look like several independent panels developed the same issue at once.
In reality, they may share an upstream dependency.
How Often Should Service Data Be Compared?
Provider relationships are easier to research with historical observations.
One snapshot tells you what exists now.
Repeated snapshots show how things change.
Useful observation periods can include:
Daily
Weekly
Monthly
The right interval depends on how quickly the catalog changes.
Highly dynamic services benefit from more frequent comparison.
A Practical Provider-Matching Checklist
When comparing two suspected services, check:
1. Service category
2. Service name
3. Price
4. Min
5. Max
6. Refill
7. Cancel
8. Speed description
9. Start-time description
10. Availability
11. Update timing
12. Historical price movement
13. Historical limit changes
14. Historical refill changes
15. Historical cancel changes
One match means little.
Several unusual matches that continue changing together are far more informative.
Can AI Identify Shared SMM Providers Automatically?
Potentially, but only as a classification or anomaly-detection problem.
A system could compare:
- text similarity,
- rate correlation,
- limit similarity,
- synchronized changes,
- catalog overlap,
- timing patterns,
- and historical observations.
It could then estimate how similar two service records are.
But such a system should not present correlation as verified ownership.
A useful output would be:
High catalog similarityrather than:
Confirmed same providerunless there is direct evidence.
What Is the Best Way to Research SMM Provider Relationships?
The most reliable public approach is to combine multiple observable signals over time.
Do not rely only on:
- price,
- service name,
- IDs,
- or marketing claims.
Instead, compare how the same or similar services behave.
The more synchronized and unusual the patterns are, the more useful the hypothesis becomes.
Final Thoughts
Two SMM panels can use the same provider without looking similar.
They can also look similar without using the same provider.
That is why provider research should be based on patterns rather than assumptions.
Useful signals include:
- unusual matching min/max values,
- synchronized price changes,
- refill and cancel changes,
- matching service descriptions,
- coordinated service outages,
- catalog additions and removals,
- stable pricing ratios,
- and repeated update patterns.
The strongest analysis combines multiple signals over time.
The key distinction is simple:
Similarity can suggest a shared provider. It does not automatically prove one.
Use the SMMFAQ Services Database to compare individual services and the SMMFAQ Provider Directory to investigate broader provider catalogs.
You may also want to read How Do SMM Panels Get Their Services?, What Is an SMM Panel Provider?, What Is an SMM Panel API?, and Why Do SMM Panel Prices Differ?.
Frequently Asked Questions
How can I tell if two SMM panels use the same provider?
Compare multiple service characteristics such as price movement, min/max, refill, cancel, descriptions, availability changes and update timing. Repeated unusual matches are more useful than one similar field.
Do matching SMM service IDs mean two panels use the same provider?
No. Service IDs are often local identifiers, so matching IDs do not prove a shared provider.
Can two panels have different service IDs but use the same provider?
Yes. Reseller panels often assign their own internal IDs to imported services.
Is identical pricing proof of the same SMM provider?
No. Similar pricing is common and should be combined with other evidence.
Are matching min and max limits useful?
Yes, especially when the limits are unusual. Common values provide weaker evidence.
Can two SMM panels share only some providers?
Yes. A panel can use different upstream providers for different platforms, categories or individual services.
Why do services disappear from multiple panels at the same time?
One possibility is a shared upstream provider disabling the service, although synchronized removal alone does not prove a relationship.
Can service descriptions reveal the original provider?
Distinctive wording and formatting can be useful clues, but descriptions can also be copied or edited.
Can SMMFAQ confirm that two panels use the same provider?
SMMFAQ can help compare observable service and provider data. Similarities should be treated as research signals unless direct evidence establishes the relationship.
What is the best evidence of a shared SMM provider?
A repeated combination of unusual matching characteristics and synchronized changes over time is generally more informative than any single field.